Dissecting Your Facility Energy Bill
Energy bills can be challenging to understand. Facility influencer Ken Sandler gives insight on what to look for during your next billing cycle.
By Ken Sandler, Facility Influencer
Key Takeaways:
- Facility energy bills are often far more complex than simple usage multiplied by cost, due to varying state regulations, deregulated markets, demand charges and layered supply, delivery and environmental fees.
- Facility managers can better control costs by understanding which parts of their bills are tied to energy usage, closely monitoring peak demand charges and exploring options like time-of-use rates, demand response programs and energy management systems.
- Energy efficiency measures, renewable energy and smarter load shifting — such as charging electric fleets overnight or using battery storage — can reduce both costs and strain on the power grid despite the confusing structure of utility bills.
Facility energy bills should, in theory, be easy to read. You used “X” amount of power last month, you were charged “Y” rate per unit of power, do the math and – voilá, here’s how much you owe.
If only it were that simple. Thanks to the complexities of how we regulate public utilities – speaking specifically about electricity and gas here – there are multiple layers of terminology, issues and math to wade through to get to the answers. Let’s break them down.
America’s checkerboard energy regulation map
To set the context, there are two complicating factors at the national level.
First, we don’t have one national power system — we have more than 50. This is because retail power generation and distribution are regulated at the state level, typically by public utility commissions (PUCs). I say “more than 50” because even within states, there are different regulatory schemes, depending on whether you’re talking about investor-owned utilities (IOUs), publicly owned utilities, electric cooperatives, merchant generators, etc. – in addition to many other variables.
The other national quirk is of more recent vintage. The earliest days of the electric industry in America showed the folly of having different companies build competing transmission and distribution networks (see the historical photos of vast tangles of wires choking poles and buildings). So, governments made a deal with the titans of the industry, the Regulatory Compact, under which each state would grant monopoly power to utilities within certain defined service areas, in exchange for strict regulations determining many details, including the rates utilities would be paid.
This arrangement held until the 1990s, when new technologies and evolving economic philosophies encouraged some states to launch deregulatory experiments. These programs injected competition into power markets, so that while utilities still had to maintain transmission lines or gas pipelines, other companies that consumers chose could transmit electricity or transport gas through them.
A wave of states deregulated their electricity systems until the program initially chosen by California led to crises in 2000-2001 including rolling blackouts. After that, the deregulatory rush slowed to a halt, leaving the U.S. with around 16 deregulated states and the rest with the old monopoly-based systems. As a result, it is even harder to generalize across states than it was before, since in addition to every state system being uniquely designed and operated, the distinction between traditionally regulated vs. deregulated states adds many new wrinkles.
Energy bill basics
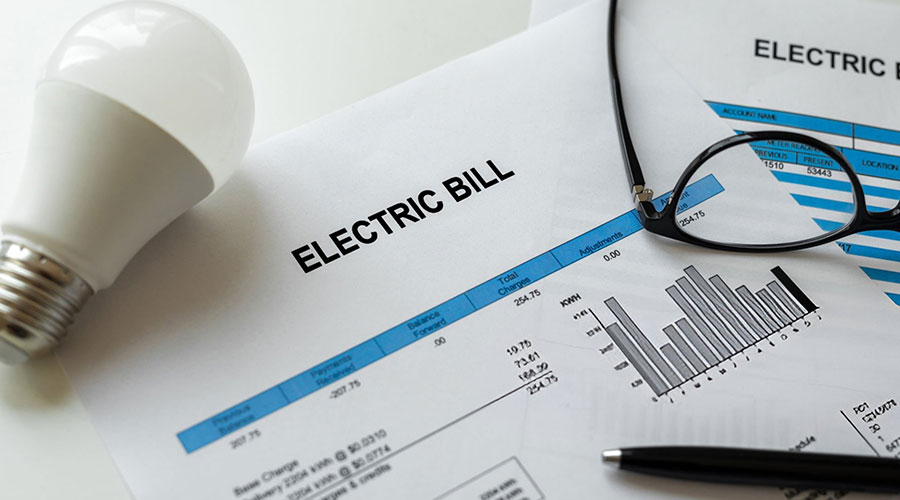
Typical energy bills will prominently display how many units of energy your facility used in the last billing period – usually in kilowatt-hours (kwh) for electricity and CCF (i.e., 100 cubic feet) and/or therms (a measure of energy output) for gas. Depending on the energy provider, they then should show the rate in dollars or cents per unit that you’re paying.
Larger businesses have the most options to choose rate designs that may be more favorable to them. For example, instead of consistently flat rates, they may prefer a “time of use” rate with cheaper prices for electricity during off-peak times if they are able to shift energy uses to such times (generally evenings).
And then come the often-painful demand charges. Typically, these charges are based on the maximum amount of power you used during the measured time period (per hour, 15-minute window, etc.) of the billing cycle. So, one bad hour out of the month – say, a hot summer day in July when air conditioners are running full blast – could send your whole bill skyrocketing.
Next, we get into the distinction of charges for energy generation/supply vs. for transmission and distribution. This distinction has become increasingly important with deregulation, where the entities supplying vs. those delivering the power may not be the same. Supply charges will generally be in dollars or cents per kwh while distribution charges (covering maintenance of infrastructure like wires, poles and transformers) will often be a fixed rate per month.
All the other charges
Just in case that’s all not confusing enough, there are usually a number of riders or fees added to the bill. These will trace back to requirements of the state utility commission which the utility has been given permission to recover by charging the customer directly for them. These are often for environmental requirements including energy efficiency programs and clean energy purchases.
The way in which these charges are often singled out strikes me as problematic, making them seem like added burdens on the ratepayer whereas traditional polluting practices of burning fossil fuels are considered “business as usual” that we’re not supposed to think twice about paying. Yet power generation from renewable sources is still power generation and increasingly represents cheaper as well as cleaner power.
Energy efficiency, for that matter, is almost always the smartest, quickest and least expensive way to extend our energy resources. Providing discounts to ratepayers of super-efficient LED light bulbs or Energy Star rated appliances benefits the entire power system by taking load off of it. Yet the presence of efficiency program charges on bills – without any context about how much money they save – has created pressures on some state politicians to unwisely curtail efficiency investments.
How to use this info
I wish I could end this piece with a clearer picture of what your facility power bills tell you and how you can use that knowledge to better manage and reduce them. But as we’ve seen, there’s a lot of murkiness here to cut through.
The responsibility for this complexity is shared among the utilities, their public utility commission regulators and the state legislators who set the rules. As these players seek to optimize among a number of goals – from system resilience, reliability, modernization and maintenance to power affordability to reducing pollution and climate impacts to keeping the utilities economically sound – some of the compromises between these goals can lead to complicated and messy results.
Still, facility managers in charge of paying the bills deserve better. Bills do tend to clearly state the amount of energy in kilowatts or therms your facility used in the past month and often have charts tracking usage over the past year for comparison. These charts may hold clues to HVAC adjustments that need to be made. Com Ed has the nice additional feature of showing the average temperatures for the past month and year, as a critical factor impacting energy use.
Sorting out the parts of the bill affected by your usage vs. those over which you have no control will give you a good idea of how much you can save by instituting efficiency measures, joining a demand response program and/or installing a solar array and perhaps battery storage.
And definitely keep an eye on those demand charges and peak time of use rates, when they occur and what you can do to shift energy use away from those most costly times to when power is cheaper. The functionality of energy management systems, aided by artificial intelligence, to make these shifts keeps improving. Charging an electric fleet, for example, can be scheduled for nighttime hours when rates are often cheaper. Similarly, batteries or ice storage systems can be used to store power when rates are at their lowest and discharge power when rates are highest.
Finally, if you’re in a deregulated state, check out the competition to your current provider, to see if cheaper and/or cleaner options may be available. Even if not, look into whether your suppliers provide any choice of rates, e.g., if you could opt for a time-of-use rate or another advantageous alternative.
While your facility energy bills may not make for exciting reading, they can yield a few buried treasures worth scooping up.
Ken Sandler, Ph.D., is a clean energy and sustainability analyst and thought leader who spent 35 years advancing green building and sustainability policies and programs across the federal government. In addition to being a FacilitiesNet sustainability columnist and Facility Influencer, he writes his own newsletter, Regenerative Futures, available on LinkedIn and Substack.
Related Topics: