Next Steps: 11 Tips For Selecting the Right Cleaning Contractor
Ever wonder why the best is the best? Or, better yet, whether there are common traits among the best of the best that can be emulated?
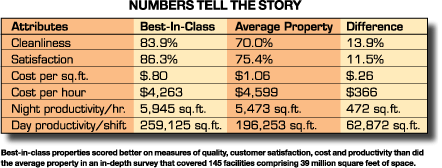
A recent inquiry into data collected from 145 facilities representing nearly 40 million square feet of space set out to identify what top-performing facilities do to select cleaning contractors that deliver cleaner facilities at a lower cost than those secured by other facilities.
Through a series of interviews and inspections with facility executives, the authors identified six facilities that scored high on all three measures of cleanliness quality, customer satisfaction and financial performance. Further inquiry into the workings of those six facilities yielded 11 characteristics that result in selecting superior cleaning contractors and services.
In general, the study found, the facilities clearly communicated expectations to competing bidders, undertook a rigorous evaluation of bids and proposals, and engaged in follow-up reviews of contract proposals before awarding a contract. Specifically, the facilities:
- Used a Cross-functional Evaluation Team
All best-in-class properties started early getting consensus and support for its procurement initiative. They assembled a cross-functional team of customers, managers and stakeholders representing all departments and interest groups. The evaluation team included those who were strongly in favor of the procurement event and those who were not. Typical members were from procurement, operations, finance, contract management and local managers.
- Reviewed and Clarified Proposals
More than 85 percent of best-in-class properties reviewed contractor information prior to actual evaluation. Designated members of the evaluation team focused on ensuring that the materials and documents presented by bidders were complete and clear. Each bidder proposal was read in detail and omissions, unclear information and confusing language was identified. In a conference call, each bidder was informed of the issues and was asked to re-submit their proposals, with the correction discussed.
- Conducted Bidder Capability Evaluations
Every best-in-class property evaluated contractor capability as part of its due diligence effort before considering price. Nearly 71 percent instituted a double-blind process to screen the identity of the bidders. In addition
- All used a numerical rating system, guided by an out-tasked subject matter facilitator.
- 85 percent used contractor process improvement programs to judge capability.
- 100 percent reviewed the contractor’s proposed cleaning program to judge capability.
- More than 80 percent looked for a contractor internal incentive and recognition system to judge capability.
- Conduct Process Capability Evaluation
More than 80 percent of the best-in-class properties considered the lack of an effective process capability as a deal-breaker. The connection between equipment, supplies and materials, and labor productivity was a major factor in short-listing bidders. All of the properties used a subject matter expert to fully understand the process capability issue. Service level commitments were documented and validated as part of the due diligence process.
- Conducted Financial Analysis
While approaches varied, every property implemented a broad market, baseline and bidder financial-value analysis and comparison. Full disclosure financial information is required and is protected by confidentiality agreements. Every line item of pricing was included in the evaluation and bidders were asked to explain material variances. Financial comparative data included labor wages, benefits and indirect costs, mandated costs, equipment-connected costs, material and chemical costs.
Perhaps the most often quoted reason for outsourcing is to “reduce costs”. Frequently, this is achieved by simply asking for -- or demanding -- a lower price or by reducing the scope of work. The strategy of focusing exclusively on savings can be a serious mistake. Best-in-class properties established a performance-savings connection to ensure value beyond mere savings.
- Conducted Risk Assessment
A few best-in-class properties applied a risk assessment model. About 29 percent of these properties used a “heat map” strategy to calculate the risk associated with each bidder proposed service system. This model identified high risk areas that would require aggressive buyer management to prevent service failure; moderate risk that required on-going attention; low risk that needed only occasional attention; and opportunity risk that suggested the possibility for added cost reduction and savings.
- Used Value Stream Mapping
This evaluation tool looked at the value of the various resources committed to the project. It highlighted the Pareto-Driven concept of the “vital few” resources that dominate the connection between the resources required and the results expected. It clarifies the choices about what to include in the implementation plan that will reduce transition time toward attaining a best practice state.
- Conducted Finalist Interviews
Every property conducted pre-decision interviews with the most qualified bidders. These were full evaluation team and full contractor team conversations as a mechanism to evaluate culture and relationship compatibility. Any and all information, proposals and issues were explored to the satisfaction of every buyer team member. All of the properties used an out-tasked subject matter expert to facilitate the interview session.
- Requested a Firm and Final Proposal and Pricing Structure
More than 85 percent of the properties conducted pre-selection reviews with the most qualified bidders. These conversations explored the strengths and weaknesses of the solution proposed by each bidder and asked for a firm and final capability and financial proposal to further the due diligence process.
- Developed a Business Case Recommendation and Decision
On the basis of the capability ratings and the firm and final proposed solution and pricing, a final choice was made. Slightly more than 43 percent of best-in-class properties presented a formal business case report to validate their recommendations. While importance varied among properties, the core of the key decision factors were remarkably similar. The decision factors included: the thoroughness of the cleaning program proposed, the perceived capability of the designated bidder project manager, the cultural fit between the companies, and the degree of confidence in the bidders phase-in/transition plan.
- Developed a Transition Compliance Checklist
More than 80 percent of best-in-class properties created a transition checklist to guide the first 90 days of contractor phase-in and work transition. The checklist identified both contractor and buyer commitments and obligations over the transition period. The checklist included everything from key control, to labor hiring, to equipment delivery, to communications protocols, to security requirements, to extras offered, and exceptions made, during the various conversations. Ultimately, compliance metrics are defined, validated and agreed to through this process.
Methodology
Narrowing the field of 145 facilities to identify the best of the best – those that would offer the most insight into how to go about successfully procuring a cleaning contract – was a data-intensive process that objectively ranked the performance of facilities to metrics the authors determined would be used in the study.
Each property was ranked through a scatter diagram to evaluate their relative performance at the intersection of cleanliness quality, customer satisfaction and cost.
Of the facilities surveyed, cleanliness quality ranged from a low of about 45 percent to a high of about 96 percent. Satisfaction ranged from a low of about 48 percent to a high of about 91 percent. Given the distribution of performance on the cleanliness and satisfaction measures, and using a more rigorous standard, the authors tightened the criteria to look at properties that exhibited better than 80 percent cleanliness and 80 percent customer satisfaction. Sixteen properties exhibited these performance characteristics.
With a focus on the sixteen best performing properties, the authors turned to the impact of price as a further criteria for refining the best of the best properties list. The goal was to identify properties that delivered 80 percent cleanliness quality and 80 percent satisfaction at less than 90 cents per square foot. The application of the price criteria narrowed the list of properties to six.
To one degree or another, best-in-class properties utilize specific processes and activities to achieve exceptional results in many areas. If the entire portfolio included in this study had followed the best-in-class procurement process, total savings to these properties would have exceeded $10.1 million per year, for each year of the contract.
Additionally, if the entire portfolio in this study had followed the best-in-class procurement process, overall cleanliness quality for these properties would have been about 14 percent greater than alternatives and satisfaction scores would have been 11 percent greater.
|
Click-to-view
Chart (pdf)
This chart identifies the area of procurement, the specific process or activity and the percent of utilization by the group of the best-in-class properties. Best-in-class performers delivered about 14 percent greater cleanliness quality, 11 percent greater levels of satisfaction and more than 470 square feet greater productivity per hour at a cost of about 26 cents less per square foot than other facilities included in the study.
|
Related Topics: